
Repository: https://github.com/everettjf/appletrace


A lightweight, embeddable Objective-C and Swift tracer that produces shareable Perfetto traces
🚀 Maintained as needed. AppleTrace captures your app's execution timeline — manual sections, Swift macros, and/or every
objc_msgSend— and renders it in Perfetto, right in the browser. Version 2.0 adds a one-commandappletraceCLI, binary traces by default, async-safe Swift macros, and a rootless / roothide jailbreak loader. See the CHANGELOG.
- What is AppleTrace?
- Key Features
- Quick Start
- How It Works
- Installation
- Usage
- The
appletraceCLI - Tracing Any App on a Jailbroken Device
- Platform & Hook Support
- Testing
- Project Structure
- FAQ
- Contributing
- License
AppleTrace is an iOS/macOS tracing toolkit. You instrument your app — with
manual APTBeginSection / APTEndSection markers, Swift @Traced macros, or by
hooking every objc_msgSend automatically — and AppleTrace records a timeline of
events into trace fragments in the app's sandbox. The appletrace command-line
tool pulls them off the device, merges them into a single trace.json, and opens
it in Perfetto to explore the call timeline,
durations, threads, and counters.

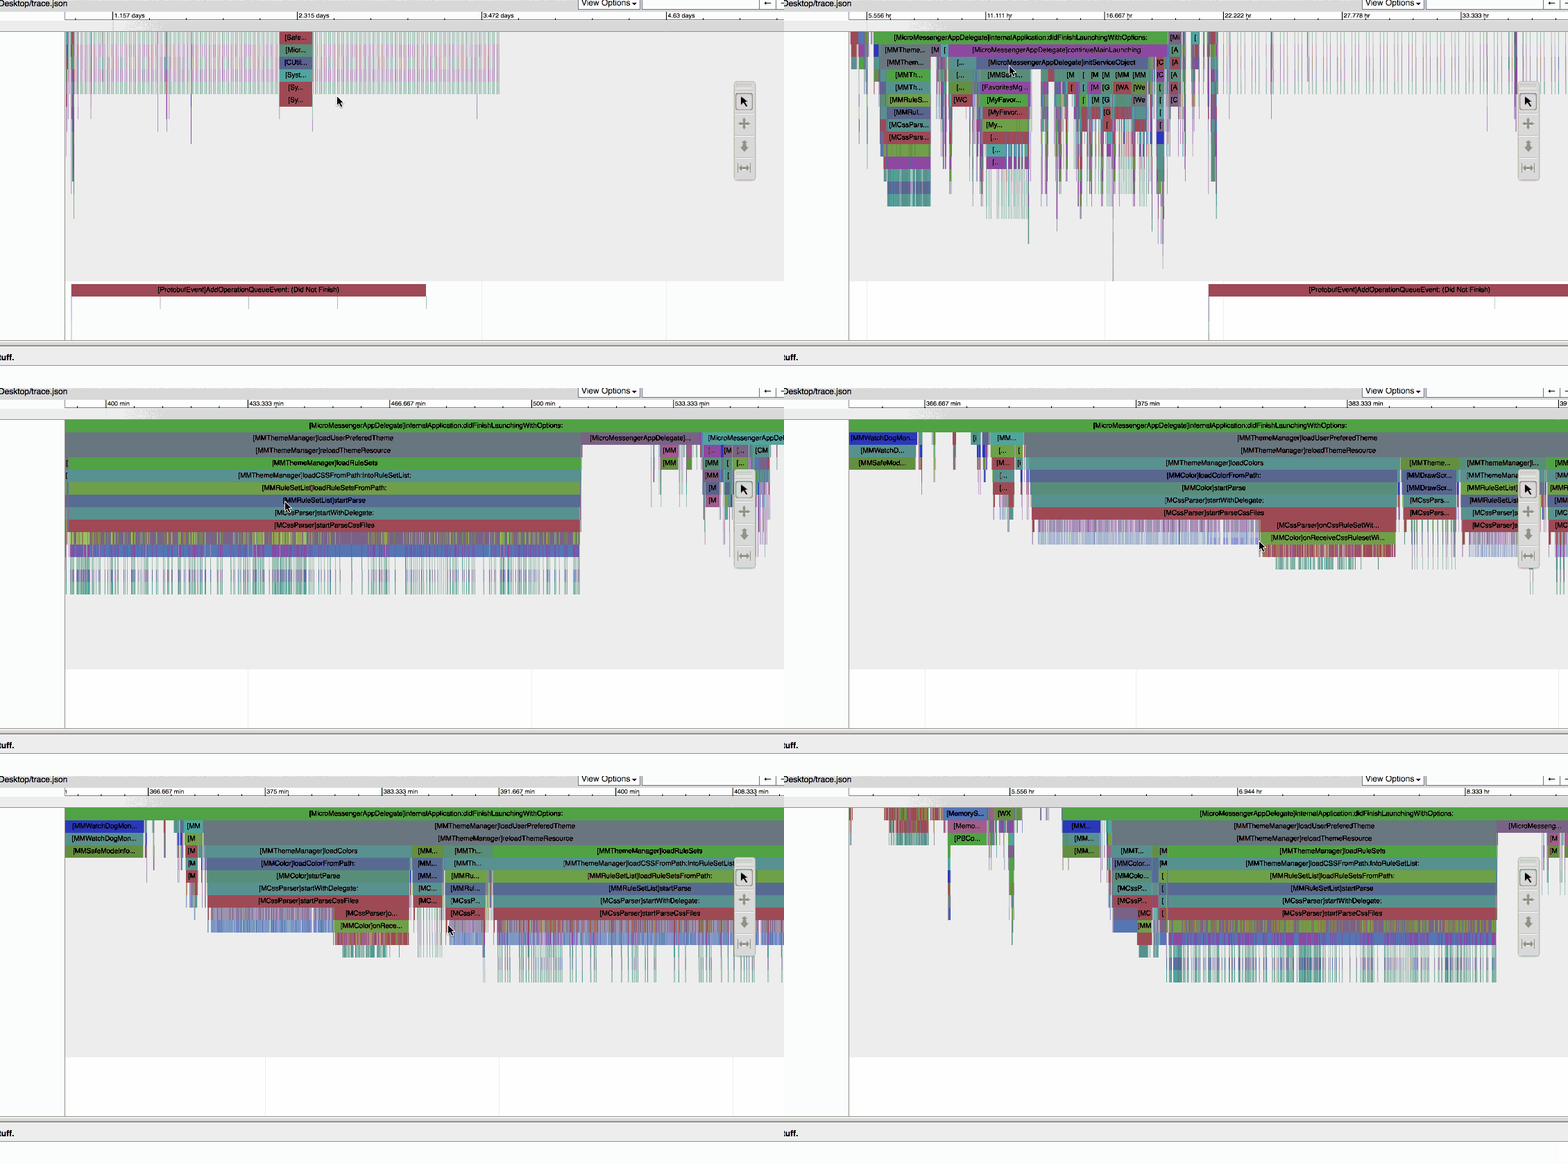
The trace visualization shows the method execution timeline and call relationships.
- 📊 Automatic method tracing — direct
objc_msgSend/objc_msgSendSuper2rebinding on arm64 and arm64e captures Objective-C activity with no source changes, including frameworks loaded later withdlopen. - 🧩 Swift macros —
@Traced/@TraceAllinstrument Swift at compile time (final classes, structs, actors, protocol extensions). Names are qualified by type (FeedViewModel.reload(force:)), andasyncfunctions get async spans, so a call that resumes on another thread afterawaitstays one slice. - 🎯 Manual sections —
APTBeginSection/APTEndSection(and theAPTBegin/APTEnd/APTScopeSectionhelpers) mark exactly the regions you care about — the lowest-risk option, works on every OS version. - 📈 Rich event types — instant markers (
APTInstant), counter series (APTCounterfor memory, FPS, queue depth, …), and async/flow events (APTAsyncBegin/APTAsyncEnd) that cross threads and dispatch queues. - ⚡ Built for the hot path — binary trace fragments by default,
(Class, SEL)name interning, pointer-cached name ids, and per-thread batched writing keepmalloc, string formatting and dispatch off the per-event path. - 💾 Crash-tolerant capture — buffers drain to a memory-mapped file every second, when the app enters the background, and at exit, so even a killed app leaves a readable trace.
- 🛠️ One-command workflow —
appletrace recordlaunches the app on a device, waits, stops it, pulls, merges, and opens Perfetto. No Python needed. - 🚦 Performance gates in CI —
appletrace summaryreports per-span count, total, self and p50/p95 times;appletrace diffcompares them with a baseline and exits non-zero when a span regressed. - 🔓 Any app on a jailbroken device — an AppleTraceLoader tweak for rootless
and roothide jailbreaks, driven by
appletrace jb …over SSH. - 🔍 Runtime filtering — scope automatic tracing with class-prefix allow/deny
lists (
APPLETRACE_TRACE_CLASS_ALLOW/APPLETRACE_TRACE_CLASS_DENY).
- 🔍 Performance analysis — find hotspots and long methods on a real timeline.
- 🐛 Debugging — follow method execution flow across threads.
- 📚 Learning — see how iOS/macOS frameworks actually dispatch.
- 🛡️ Security research — analyze third-party app behavior on a jailbroken device.
git clone https://github.com/everettjf/AppleTrace.git
cd AppleTrace
swift build -c release --product appletrace     # builds .build/release/appletrace
Prebuilt appletrace binaries, an appletrace.xcframework, and the jailbreak
packages are attached to each GitHub release.
sample/AppleTraceSwiftDemo runs a curated, multi-threaded workload
(app-startup spans, parallel ImageDecoder / NetworkClient / DatabaseWriter
threads, async download arcs, Swift-concurrency @Traced async methods, and a
60-frame render loop with live FPS / memory counters).
open sample/AppleTraceSwiftDemo/AppleTraceSwiftDemo.xcodeproj   # Run it on a device once to install it

# Then record it end to end — launch, wait, stop, pull, merge, open Perfetto:
swift run appletrace record --bundle-id com.everettjf.AppleTraceSwiftDemo \
  --env APPLETRACE_AUTORUN=1 --open
On the Simulator, tap Generate Trace and run the `swift run appletrace open
` command the app shows.Two samples are included:
| Sample | Language | Shows |
|---|---|---|
sample/AppleTraceSwiftDemo |
Swift | withSpan + @Traced / @TraceAll macros (incl. async), counters / async spans, and the AppleTraceAuto SwiftTrace auto-hook |
sample/TraceAllMsgDemo |
Objective-C | Manual APTBeginSection sections and the automatic objc_msgSend hook |
#import <appletrace/appletrace.h>

- (void)yourMethod {
    APTBegin;            // section named "[ClassName yourMethod]"
    // ... your code ...
    APTEnd;
}APTInstallObjcMsgSendHook(); // or, from Swift: AppleTrace.installObjCMsgSendHook()# …or without code changes, via environment variable (what `appletrace record --hook` sets):
export APPLETRACE_AUTO_HOOK_OBJC_MSGSEND=1# Development-signed app on a connected device:
swift run appletrace record --bundle-id com.example.MyApp --duration 15 --hook --open
# Or pull / merge / open separately:
swift run appletrace pull --bundle-id com.example.MyApp -o mytrace
swift run appletrace open mytraceappletrace open hands the trace to ui.perfetto.dev
through a local page in your browser — the file is never uploaded. You can also
drag trace.json into Perfetto yourself.
   Your app (instrumented)                 appletrace CLI (macOS)            Browser
┌────────────────────────────┐      ┌──────────────────────────┐      ┌────────────────┐
│ APTBeginSection / @Traced   │      │ record / pull (devicectl,│      │                │
│ APTInstant / APTCounter     │ ───► │   or SSH on jailbreak)   │ ───► │ ui.perfetto.dev│
│ APTAsyncBegin / async spans │      │ merge → trace.json       │      │                │
│ objc_msgSend auto-hook      │      │ open → local hand-off    │      │                │
└────────────────────────────┘      └──────────────────────────┘      └────────────────┘
   per-thread batches → mmap'd            X-complete collapse
   <sandbox>/Library/appletracedata       binary + text fragments
- Instrument — add manual markers or Swift macros, or install the
objc_msgSendhook. - Capture — events accumulate in per-thread buffers, are shipped in order
to a serial writer, and land in memory-mapped binary fragments under
<app sandbox>/Library/appletracedata. - Merge —
appletrace mergedecodes the fragments and collapses begin/end pairs into PerfettoXcomplete events. - Visualize —
appletrace openloadstrace.jsoninto Perfetto.
| Requirement | Version | Used for |
|---|---|---|
| macOS | 12+ | Build environment and the appletrace CLI |
| Xcode | 16+ (Swift 6 toolchain) | Package, framework, and samples |
| iOS / macOS deployment target | iOS 15+ / macOS 12+ | Apps that embed AppleTrace |
| Perfetto | Web | Visualization at ui.perfetto.dev |
| ldid, xz | Optional | Building the jailbreak packages |
| Python | Optional, 3.9+ | Legacy merge.py tooling and its tests |
.package(url: "https://github.com/everettjf/appletrace.git", from: "2.1.0")| Product | What it is |
|---|---|
AppleTrace |
The C core + objc_msgSend hook, the Swift API, and the @Traced / @TraceAll macros |
AppleTraceAuto |
Optional SwiftTrace bridge (Simulator / macOS only) |
AppleTraceKit |
Fragment decoding and merging, for your own tooling |
appletrace |
The command-line tool |
Use the appletrace.xcframework from the release, or build the framework:
xcodebuild -project appletrace/appletrace.xcodeproj -scheme appletrace \
  -configuration Release -sdk iphoneos build
The automatic hook supports arm64 and arm64e. arm64e replacements in chained-fixup
__auth_gotslots are signed with the standard function-pointer PAC schema. Simulator / Intel slices build a stub whose install call returnsNO.
Objective-C
#import <appletrace/appletrace.h>

- (void)viewDidLoad {
    APTBegin;                 // auto-named "[ClassName viewDidLoad]" (interned, no per-call allocation)
    [super viewDidLoad];
    APTEnd;
}

- (void)networkRequest {
    APTBeginSection("network");   // explicit section name
    // ... network code ...
    APTEndSection("network");
}
C / C++
#include <appletrace/appletrace.h>

void saferCppFunction() {
    APTScopeSection("processing");   // RAII: ends automatically at scope exit
    APTScopeSection("inner");        // several per scope are fine
    // ... C++ code ...
}The objc_msgSend hook can't see Swift's static / vtable / witness dispatch, so
Swift is traced at the source level:
import AppleTrace

// Scoped span (closes even on throw / early return). String literals bind to a
// StaticString overload that passes the literal straight to the C core.
withSpan("loadFeed") { try? loadFeed() }

// Async work: an async span may begin and end on different threads.
let feed = try await withAsyncSpan("fetchFeed") { try await api.feed() }

// Annotate — the span name is qualified by type: "FeedViewModel.reload(force:)".
@TraceAll
final class FeedViewModel {
    func reload(force: Bool) { /* traced */ }
    func refresh() async throws { /* async span: survives thread hops at await */ }
    @NotTraced func hotPath() { /* excluded */ }
}

@Traced("feed.decode")       // explicit name
func decodeImage() { /* ... */ }
The runtime drains buffers every second, on backgrounding, and at exit; call
AppleTrace.flush() only when you read the trace in-process.
Want zero-annotation auto-tracing of a class hierarchy? The optional
AppleTraceAuto product bridges SwiftTrace:
import AppleTraceAuto
AppleTraceAuto.trace(aClass: FeedViewModel.self)   // entry/exit → AppleTrace
AppleTraceAuto is Simulator / macOS only (SwiftTrace patches
pointer-authenticated vtable slots, unsafe on real devices — gate it with
#if targetEnvironment(simulator)), and it can't see final /
statically-dispatched methods. The macros have neither limitation and are the
on-device path. See docs/swift-tracing.md.
APTInstant("cache_miss");                 // a point in time
APTCounter("resident_mb", 142.5);         // a value over time

uint64_t requestID = APTNewAsyncID();     // process-unique id
APTAsyncBegin("image_load", requestID);
dispatch_async(queue, ^{
    // ... work on another thread ...
    APTAsyncEnd("image_load", requestID);
});
In Swift, withAsyncSpan and @Traced on async functions record the current
task's name (Swift 6.2 Task(name:) / addTask(name:), iOS 26 / macOS 26 and
later) as the span's task argument. From Objective-C or C, pass a label with
APTAsyncBeginWithTask(name, id, label).
APTSetEnabled(NO);                       // Temporarily pause recording
APTSetEnabled(YES);                      // Resume
BOOL on = APTIsEnabled();                // Query state
APTFlush();                              // Force buffered writes to disk
NSLog(@"trace dir = %s", APTGetTraceDirectory());
BOOL hooked = APTIsObjcMsgSendHookInstalled();| Variable | Default | Meaning |
|---|---|---|
APPLETRACE_ENABLED |
1 |
Record at all (0 to start paused) |
APPLETRACE_DATA_DIR |
<sandbox>/Library/appletracedata |
Where fragments are written |
APPLETRACE_FORMAT |
binary |
binary or text (JSON lines, for debugging). APPLETRACE_BINARY=0/1 still works |
APPLETRACE_FLUSH_INTERVAL_MS |
1000 |
Background drain interval; 0 disables |
APPLETRACE_BLOCK_SIZE_MB |
16 |
Fragment size before rolling over (1–256) |
APPLETRACE_KEEP_EXISTING |
0 |
Keep previous traces (appletracedata_N) instead of replacing them |
APPLETRACE_AUTO_HOOK_OBJC_MSGSEND |
0 |
Install the objc_msgSend hook at load |
APPLETRACE_TRACE_CLASS_ALLOW |
— | Comma-separated class-name prefixes to trace |
APPLETRACE_TRACE_CLASS_DENY |
— | Prefixes never traced (wins over allow) |
Malformed values are logged and ignored (the default applies).
appletrace merge <trace-dir> [-o trace.json] [--raw]
appletrace open <trace-dir | trace.json>
appletrace summary <trace>... [--top 20] [--sort total|self|mean|p50|p95|max|count|name]
                   [--only <prefixes>] [--json] [-o summary.json]
appletrace diff <baseline> <current> [--metric total|self|mean|p50|p95|max|count]
                [--threshold 10%] [--min-delta 1ms] [--only <prefixes>]
                [--fail-on-missing] [--all] [--json]
appletrace devices
appletrace pull   --bundle-id <id> [--device <udid|name>] [-o <dir>]
appletrace record --bundle-id <id> [--device <udid|name>] [--duration <sec>]
                  [--hook] [--allow <prefixes>] [--deny <prefixes>] [--text]
                  [--env KEY=VALUE]... [-o <dir>] [--open]
appletrace jb install|enable|disable|list|pull|record …
recordlaunches the app throughdevicectlwith the matchingAPPLETRACE_*environment, waits, stops it, pullsLibrary/appletracedata, and merges. Use it for development-signed apps; useappletrace jb recordfor anything else.mergereads both binary and text fragments (including ones left by a killed process) and collapses begin/end pairs unless--rawis given.summaryprints per-span count, total, self, mean, p50, p95 and max durations; each argument is one run, and several runs combine.-osaves the summary as a baseline.diffcompares two traces or summaries and exits with status 2 when a span regressed by more than--thresholdand--min-delta(1 on errors, 0 otherwise). See docs/ci-performance-gates.md for a GitHub Actions setup.- The Python
merge.py/scripts/appletrace_cli.py/go.shtools still work and produce the same output.
The AppleTraceLoader tweak injects AppleTrace into apps you choose, on
rootless (/var/jb, e.g. Dopamine) and roothide jailbreaks. It derives
the jailbreak root from its own path, so the same binaries work on both.
-
Install the package from the release (or build it with
./scripts/build_jailbreak_packages.sh):- rootless:
appletrace-loader_<version>_iphoneos-arm64.deb - roothide:
appletrace-loader_<version>_iphoneos-arm64e.deb
appletrace jb install appletrace-loader_2.1.0_iphoneos-arm64e.deb --host <device> [--port 22]
jb installrunsdpkgand needs root SSH. If you can only log in asmobile(e.g. roothide, wheresudoasks for a password), install the.debwith Sileo / Zebra instead and pass--user mobileto every otherjbcommand — they don't need root. - rootless:
-
Record an app (it is relaunched with tracing enabled, then stopped, pulled and merged):
appletrace jb record com.example.App --host <device> --duration 15 --hook \
  --allow "EX,App" --open
Or step by step:
appletrace jb enable <bundle-id> --hook, use the app,appletrace jb pull <bundle-id>,appletrace open appletracedata-<bundle-id>, andappletrace jb disable <bundle-id>when done.
enable writes <jbroot>/var/mobile/Library/AppleTrace/<bundle-id>.plist (the
APPLETRACE_* variables to apply). The loader only touches apps that have such a
file, and writes a short status line — jailbreak root, rebinding diagnostics,
trace directory — to the app's tmp/AppleTraceLoader.log, which jb pull
prints. SSH needs key-based login (ssh-copy-id); over USB you can forward port
22 with iproxy 2222 22 and pass --host 127.0.0.1 --port 2222. Extra ssh/scp
options go in APPLETRACE_SSH_OPTIONS (e.g. "-i ~/.ssh/device_key").
Verified on a roothide jailbreak (iPhone 11, iOS 26.0.1): a Flutter App Store app recorded 22,849 hooked sends across 10 threads, class filters and the text format work, and injected arm64e system apps run normally.
Limitation — sealed apps. On iOS 26, Apple's own apps map their read-only
__DATA_CONSTas a permanent, non-writable region, so their GOT can't be rebound and the hook sees no sends from them (AppleTraceLoader.logshowsmain_executable_slots=0 main_protect=2). Third-party apps are unaffected. The loader leaves sealed apps running normally.
| Mode | arm64 | arm64e | x86_64 (Simulator / Intel Mac) |
|---|---|---|---|
| Manual sections, Swift macros & explicit events | ✅ | ✅ | ✅ |
Automatic objc_msgSend / objc_msgSendSuper2 hook |
✅ | ✅ | — (stub returns NO) |
| Jailbreak loader (rootless / roothide) | ✅ | ✅ | — |
- Manual sections and macros are the lowest-risk baseline and work on every supported OS version.
- The auto-hook wraps every rebound send in an assembly trampoline that preserves integer, floating-point, stack-passed and aggregate-return ABI state; it is validated on the Simulator, on an arm64e iPhone 17 Pro (iOS 27), and on an iPhone 11 (iOS 26.0.1) in both arm64 and arm64e builds.
- The hook rebinds GOT slots of the app and of frameworks it loads; calls
between system frameworks in the shared cache are not routed through a
rebindable GOT, so they don't appear.
APTObjcMsgSendHookDiagnostics()reports how many slots were rebound. - With a deployment target of iOS 14+ / macOS 11+, clang emits
objc_alloc_init/objc_opt_*calls instead of somealloc,init,classandselfmessage sends, so those don't appear as hooked events.
swift test                                     # macros, runtime, async spans, concurrency, decoder
./scripts/test_batching_stress.sh              # writer stress: formats, drains, SIGKILL, rollover, bad config
./scripts/test_ci_gates.sh                     # appletrace summary / diff and their exit statuses
./scripts/test_objc_msgsend_hook.sh            # hook smoke test on the Simulator
./scripts/test_objc_msgsend_hook_experimental.sh
DEVICE_UDID=<udid> ./scripts/test_objc_msgsend_hook_device.sh                  # real device, arm64
DEVICE_UDID=<udid> DEVICE_ARCH=arm64e ./scripts/test_objc_msgsend_hook_device.sh
python3 -m pytest Tests                        # legacy Python exporter
The stress test runs 8 threads × 25,000 nested and dynamically named sections in
text and binary modes, with a 1 ms background drain, without an explicit flush,
after SIGKILL, across fragment rollover, with malformed configuration, with an
unwritable directory, and with tracing disabled — and asserts exact counts and
correct nesting every time.
AppleTrace/
├── appletrace/              # Core tracing framework (appletrace.xcodeproj)
│   └── appletrace/src/      # C++ core + objc_msgSend hook (shared with SwiftPM)
├── Sources/
│   ├── CAppleTrace/         # SwiftPM wrapper around the core + hook
│   ├── AppleTrace/          # Swift API and macros
│   ├── AppleTraceMacrosPlugin/
│   ├── AppleTraceAuto/      # SwiftTrace bridge
│   ├── AppleTraceKit/       # Fragment decoder + merger
│   └── AppleTraceCLI/       # `appletrace` command-line tool
├── Tests/                   # Swift tests, Python tests, stress harness
├── loader/                  # Jailbreak AppleTraceLoader tweak (rootless / roothide)
├── sample/                  # Swift and Objective-C demo apps
├── scripts/                 # Test, stress and packaging scripts
├── docs/                    # Format and design notes
├── Tutorial/                # GitHub Pages tutorial
├── sampledata/              # Demo trace for Perfetto
└── merge.py, appletrace_binary.py, go.sh   # Legacy Python tooling
Is AppleTrace still maintained? Yes — maintained as needed. With the arrival of the AI era, there is even more that can be explored and improved when the need arises.
Does AppleTrace work on recent iOS versions? Yes. Manual instrumentation and Swift macros work everywhere; the automatic hook is validated on iOS 26 and iOS 27 hardware (arm64 and arm64e).
Can I trace third-party apps? Yes, on a rootless or roothide jailbreak — see Tracing Any App on a Jailbroken Device.
Is Python still required?
No. The appletrace CLI replaces it. merge.py remains for existing scripts.
Can I use this on macOS apps? Yes — AppleTrace works for both iOS and macOS applications.
Why don't I see [NSObject alloc] / init in hooked traces?
See the note in Platform & Hook Support: the
compiler replaces those sends with direct runtime calls.
Contributions are welcome! Please read the Contributing Guide and AGENTS.md for repository conventions.
- Fork the repository.
- Create a feature branch:
git checkout -b feature/amazing-feature - Commit your changes (run the test suite first).
- Push and open a Pull Request.


Inspired by Facebook's fbtrace, and built around Google's Perfetto and the Trace Event Format.
AppleTrace is released under the MIT License. See LICENSE for details.


